Only days ago, Bitcoin was fighting to reclaim $84,000. After the hot CPI report, the conversation has shifted from resistance to support. The question now is how much room Bitcoin has before the next big round number, $80,000, comes into play.
Where Bitcoin stands
Following the inflation report, Bitcoin traded at $81,494.58, down 3.6%, with a market cap of $1.617 trillion and 24-hour trading volume of $40.109 billion. That is a meaningful move for the largest crypto asset, and it erases the recovery that began earlier in the week.
It is worth remembering how the day started. Ahead of the report, Bitcoin was consolidating in a narrow range, capped by $84,000 supply. Another outlook noted that Bitcoin was aiming for the $85,000 resistance. The market was clearly positioned for an upside break, which helps explain why the reversal was so sharp.
Why $80,000 attracts attention
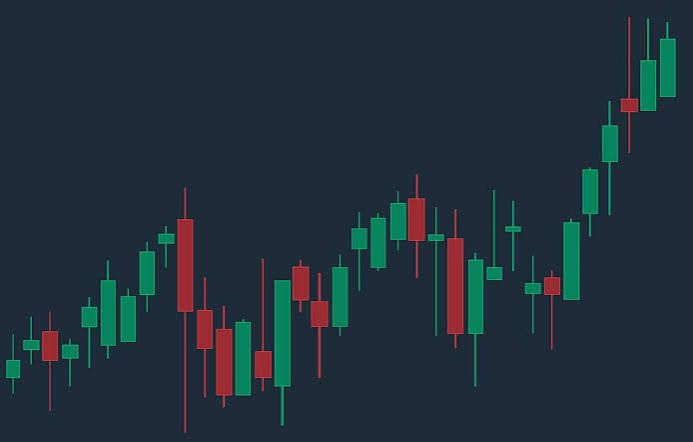
Round numbers matter in trading because many orders cluster around them. Traders place stop-losses, buy orders and options strikes near levels like $80,000, so price often reacts strongly when it approaches them. A prominent technical outlook this week was titled “Bitcoin falls on hot CPI: Why $80,000 support matters.” The headline shows how analysts are framing the next test.
Support works because buyers who missed earlier rallies, or who see value, tend to step in near such levels. If buyers defend it, Bitcoin can stabilise. If it breaks decisively, sellers may gain control and the next downside targets come into view.
The ETF angle
Fund flows add another layer. After the report, spot Bitcoin ETFs recorded a net outflow of $261.46 million, which was the third-largest outflow of October. That follows the strong $175.62 million inflow on the previous trading day, so the reversal was abrupt.
Context matters here, though. Total net assets across Bitcoin ETFs stood at $104.83 billion, and the 30-day net flow was still positive at $1.64 billion. In other words, a bad day does not erase the larger picture of steady institutional ownership. It does, however, show how sensitive flows are to macro news.
More than a crypto story
Bitcoin’s fall was not isolated. On October 13, it briefly climbed back above $84,000 before retreating as a broad Asian equity rout deepened and dragged global risk appetite lower. After the CPI report, analysts also noted that Bitcoin and gold both dropped together. When both fall at once, the market is usually reacting to something broad, such as expectations for interest rates, not to a Bitcoin-specific issue.
Scenarios to keep in mind
- Support holds near $80,000. Bitcoin consolidates, volatility cools, and the $84,000 to $85,000 zone becomes the next target again.
- Support breaks. Forced selling and weaker sentiment could extend the decline, and traders would start looking at lower support zones.
- Sideways chop. Price stays between $80,000 and $84,000 until new macro information arrives.
What to watch next
- Whether daily closes stay above $80,000.
- Whether ETF flows return to inflows after the CPI shock.
- Any change in rate expectations from central bank commentary.
The takeaway: Bitcoin has gone from testing resistance to defending support in a matter of days. The $80,000 level is now the line that traders, funds and algorithms are watching most closely, and how Bitcoin behaves there will shape sentiment for the rest of October.